Shawn Anderson could you record a video walk through explaining this experiment, findings and what it means on a higher level for token design/ecosystems?
Then we can write a few paragraphs in here and link to the video 🙏
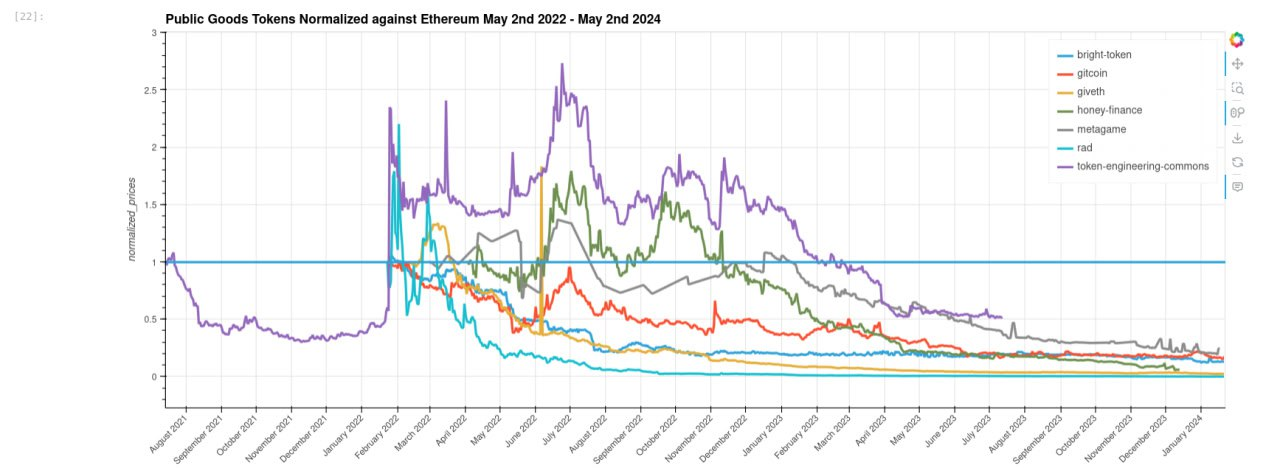
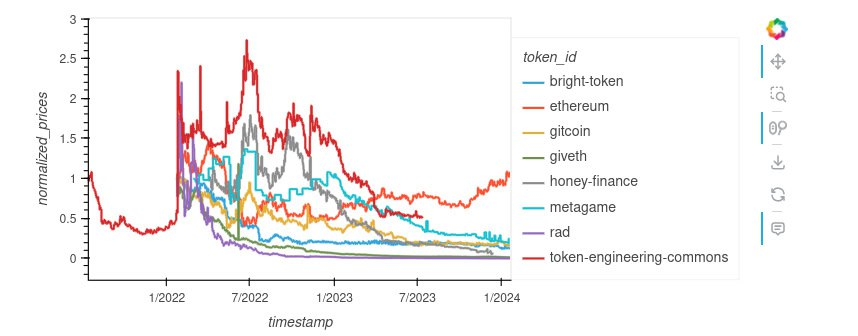
Many public goods tokens haven't done well financially during the bear market. However, the TEC token managed to hold steady and often outperform Ethereum. When comparing to the other public goods tokens, TEC , has the best overall performance interms of its Sharpe ratio, which compares the return of an investment with its risk.
Sharpe Ratio=Rp−Rfσp\text{Sharpe Ratio}= \frac{R_p-R_f}{\sigma_p}Sharpe Ratio=σpRp−Rf
where:
RpR_pRp
=return of portfolio
RfR_fRf
=risk-free rate
σp\sigma_pσp
=standard deviation of the portfolio’s excess return